[cs_content][cs_section parallax=”false” separator_top_type=”none” separator_top_height=”50px” separator_top_inset=”0px” separator_top_angle_point=”50″ separator_bottom_type=”none” separator_bottom_height=”50px” separator_bottom_inset=”0px” separator_bottom_angle_point=”50″ style=”margin: 0px;padding: 45px 0px;”][cs_row inner_container=”true” marginless_columns=”false” style=”margin: 0px auto;padding: 0px;”][cs_column fade=”false” fade_animation=”in” fade_animation_offset=”45px” fade_duration=”750″ type=”1/1″ style=”padding: 0px;”][cs_text]
[dropcap]W[/dropcap]
e have found that when doctors and team members know how to read an income statement, the practice is likely to know how to operate more efficiently. As Warren Buffet has said, “Accounting is the language of business.” You either learn it or dismiss it at your peril. The numbers tell a story. In this article, we will review what an income statement is, the main expense categories, and how to interpret the numbers to create an actionable game plan for your team.
We have found that, regardless of the amount of monthly revenue, dentists who control costs can keep their overhead in the 50th percentile, before paying themselves. [x_blockquote]”Accounting is the language of business and there’s nothing like getting it early and getting it into your system.
“… It’s a language all of its own. Getting comfortable in a foreign language takes a little experience, a little study, early on but it pays off big later on.”
– Warren Buffet[/x_blockquote]
What is an Income Statement?
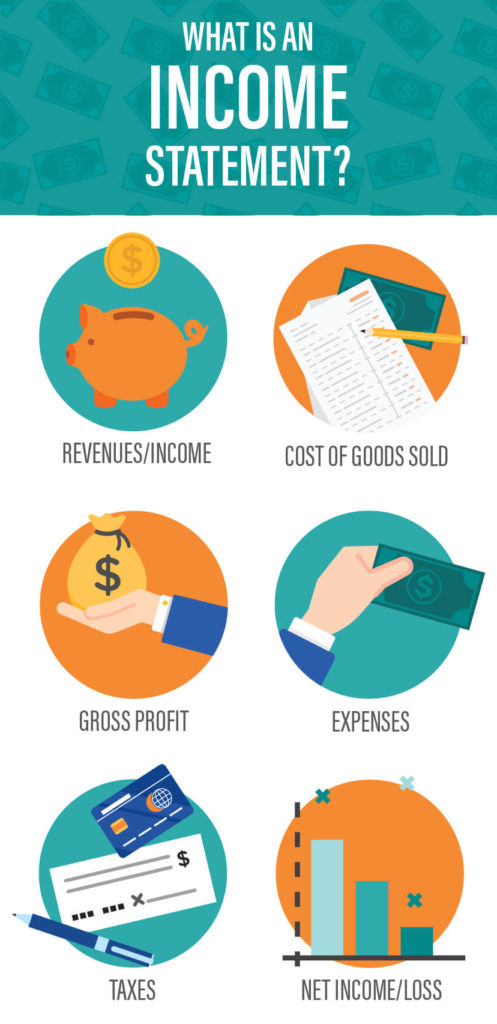
An income statement provides a snapshot of the revenue and expenses of your practice, and thus shows profitability for a given period of time, typically a month, a quarter, or year. It also categorizes expenses into broader categories for meaningful purposes. The “top line” is revenue and, after expenses, the “bottom line” shows profit (or loss). (Profit is not the same thing as cash, which is a topic for a separate post.) If you are making a profit, you are “in the black”, while a loss is “in the red”. Interestingly, “Black Friday” is when a lot of big box stores finally turn a profit and are in the black. This loosely means their revenue barely covers their expenses for 11 months out of the year.
Keep It Simple: 6 Expense Categories
We have seen too many income statements that do not group or consolidate expenses by category in their chart of accounts. The value of an accountant that specializes in dentistry is enormous. Instead of mere hindsight, they should be able to use strategic foresight to help you understand where your practice needs work. Here are the categories that are fairly standard in the dental industry:
- Lab: 6-8%
- Supplies: 5%
- Payroll: 25%
- Marketing: 3-5%
- OG&A: 10.5%
- Facility: 8%
- Total Expenses: 57-61.5%
If your total expenses should be around 60% of revenue, this is another way of saying that you work about 12 days a month (60% of 20 days) just to cover expenses, and the final 8 days to make a profit. As a somewhat unrelated side note, if you are paying the government around 40% of your income, you are working about 5 months out of the year for the state before you get to keep your income!
Payroll as an Example
It is by grouping these expenses into categories and dividing each one by revenue that we can gain real insight into the practice. For example, payroll as an expense category can include payroll (salaries, wages, and bonuses), continuing education, scrubs, and payroll taxes. We then divide all of the payroll expenses by total revenue to arrive at payroll as a percentage of revenue, with the goal being close to 25%. We recommend looking at payroll by month, quarter, and year, with quarterly being the primary driver for decision-making. By looking at payroll percentage as a quarterly metric, we can even out months where there may be 3 payroll periods, thus skewing the monthly payroll metric high, and others that may be lower.
What if payroll is under 25%? If payroll is at 18% of revenue, is that good or bad? Your workers are extremely productive but likely feeling the weight of carrying a heavy load that could be lightened by additional workers. It is also likely that you need to hire to further increase revenue. The value of knowing your numbers can help guide your hiring decisions. If you make a new hire, you should project that you will collect around 4 times what you are paying them. If you hire someone at $12 an hour, 40 hours a week, 4 weeks a month, that is around $2,100, with payroll taxes, a month. You should expect to collect $8,400 in new revenue to justify that hire, i.e., $2,100 divided by $8,400 is 25%.
What if payroll is over 25%? If payroll is consistently approaching the 30% mark, it is too high by industry standards. Since payroll is typically fixed for most offices, there are a few solutions to choose from:
- Raise revenue to lower the percentage
- Cut team members’ salaries, wages, and/or bonuses
- Reduce team members’ hours or days worked
- Fire team members
Ask your team which one they prefer! Cutting payroll expenses is not good for morale but may be a last resort if you have exhausted other options. Your best bet is to figure out how to raise revenue.
How to Increase Revenue (P*Q)
Revenue is a function of price times quantity (P*Q). We can then further dissect your revenue options for solving the payroll problem. Essentially, you can raise prices and/or do more procedures. It is pretty straightforward to raise UCR fees in your practice management software, although you should consider your costs, what competitors are charging for common procedures (call around), and ultimately what the consumer is willing to pay.
Raising prices could also come from either negotiating with insurance companies or dropping out of PPO plans. If you can raise fees, your revenue will increase without increasing quantity. You should be raising your fees around twice a year, and perhaps not uniformly across procedures. You may discount some procedures while having others remain high, depending on your practice, strategy, and target market.
You could also start selling retail products that require no additional chair time. Electric toothbrushes, fluoride toothpaste, and mouth rinse could all bring in additional revenue with very little extra work. You could also find assistant-only procedures such as whitening that bring in additional revenue with little doctor time involved.
Doing more procedures (increasing quantity) is another way to increase revenue. If you feel that you are maxing out your chair time (a useful metric is to produce between $25,000 – $30,000 per treatment room per month), then perhaps you should consider expansion. However, most practices we have seen could benefit from more efficient scheduling. Staggered (versus linear) scheduling and utilizing 2-3+ assistants to maximize doctor time and not chair utilization will lead to a 50%+ increase in production.
You should think of procedures in terms of setup time, procedure time, and cleanup time. If you can reduce the number of setups and cleanups, thus increasing the number of procedures per visit, you will be more efficient and produce more per patient. This means figuring out how to persuade patients to accept more treatment, and perhaps more importantly, how it will be financed. This allows the patient to not have to take off work multiple times, get numb multiple times, etc, and will increase production significantly.
Further Knowledge
We have enumerated a few ways to look at payroll in this article to illustrate the value in knowing your numbers to gain valuable insight and drive decision-making and strategy. Review your numbers each month, quarter, and year to know where you stand and take action to get your expenses in line with industry standards. Knowing some basic accounting will go a long way in terms of profitability. Working with an Elevate accountant will allow you to know your metrics and to find ways to take action in your practice.
[/cs_text][x_gap size=”25px”][x_share title=”Share this Post” share_title=”” facebook=”true” twitter=”true” google_plus=”true” linkedin=”true” pinterest=”true” reddit=”true” email=”true” email_subject=”Hey, thought you might enjoy this! Check it out when you have a chance:”][/cs_column][/cs_row][/cs_section][cs_section parallax=”false” separator_top_type=”none” separator_top_height=”50px” separator_top_inset=”0px” separator_top_angle_point=”50″ separator_bottom_type=”none” separator_bottom_height=”50px” separator_bottom_inset=”0px” separator_bottom_angle_point=”50″ style=”margin: 0px;padding: 45px 0px;”][cs_row inner_container=”true” marginless_columns=”false” style=”margin: 0px auto;padding: 0px;”][cs_column fade=”false” fade_animation=”in” fade_animation_offset=”45px” fade_duration=”750″ type=”1/1″ style=”padding: 0px;”][x_author title=”About the Author” author_id=””][/cs_column][/cs_row][/cs_section][/cs_content]